Quantifying the True Cost of Inflation
What inflation really means for your cost of living, as measured by Gold...
THE U.S. GOVERNMENT'S official Consumer Price Index (CPI) won't be released for another couple of weeks, writes Brad Zigler of Hard Assets Investor.
July's inflation data will be released on August 14. Inflation at the wholesale level won't be chronicled until the Producer Price Index (PPI) report of August 19.
But it's a pretty safe bet that these reports will tell us what we already know. Prices are higher, largely because of food and fuel.
Question is, do the official indexes accurately reflect the true cost of living as it's experienced by the average US consumer? As a counterpoint to the official Consumer Price figures, Hard Assets Investor likes to keep track of the Breakfast Index.
Inflation, whether measured by the government's methods or by our own homegrown metrics, boils down to a loss of purchasing power. If your George Washingtons buy you less food or petrol now than they did a year ago, that's inflation. You need more dollars to buy the same amount of stuff.
The government plays a much bigger role in the inflation drama than mere reporter, of course. As it sets monetary and fiscal policy, the government is, in fact, an agent of inflation. The effect of these policies is best seen through the lens of the currency market.
Compare the cost of Gold – a traditional store of value – in greenbacks with its Euro value over the past eight years. The metal has risen on average by 9.4% in terms of the single currency each year. But Gold's gained 15.8% on average vs. the Dollar.
All told, inflation's chipped away at the US Dollar's gold-purchasing power by an annual average of 17.2%.
| Date | Euro Price | Dollar Price | Change in US Dollar Purchasing Power |
| 01/01/00 | 286.99 | 289.00 | |
| 01/01/01 | 290.14 | 273.20 | 5.90% |
| 01/01/02 | 312.77 | 278.80 | 12.40% |
| 01/01/03 | 331.77 | 348.30 | -5.90% |
| 01/01/04 | 331.19 | 416.50 | -24.50% |
| 01/01/05 | 323.50 | 438.80 | -27.70% |
| 01/01/06 | 436.47 | 516.76 | -18.30% |
| 01/01/07 | 482.84 | 637.00 | -29.80% |
| 01/01/08 | 567.28 | 883.87 | -49.70% |
| Average | 9.40% | 15.80% | -17.20% |
No more striking example of inflation can be found than that seen in the oil market.
Congress has been looking to pin the blame for spiraling oil prices on speculators in the NYMEX trading rings and in the ICE cybermarket, but it has paid scant attention to looking for perpetrators on the National Mall.
In past 25 months, West Texas Intermediate crude's soared from $70 to $125 a barrel. If we again use the Euro as our benchmark, we can trace $45 of that price hike to currency erosion alone.
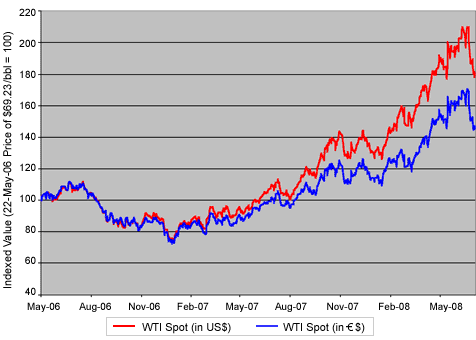
Oil's price has, indeed, shot up over the past couple of years. But matters have been made worse by a policy of talking up a Strong Dollar while knocking the chair out from under it.


 Email us