U.S. House Prices in Gold
The broad sweep since 1890 of US housing priced in gold ounces...
PITCHING ANY CONCLUSIONS on "national" US home-price trends starts as a fool's errand.
Even the UK's small, tightly-packed mainland, floating off the edge of Europe, includes disparate and distinct real-estate markets. Glasgow is as different from London as Cornwall from Cheshire. But in the main (and the mania), and with a peak of 185,000 new dwellings under construction in 2006, the broad sweep of house-price inflation...followed by an inevitable slump lasting six years or so...tends to apply across the nation.
In the United States, in contrast, new housing starts at the peak of what pundits, economists and investment bankers clearly felt was a coast-to-coast boom in 2006 approached 1.63 million amid a total housing market of 128 million units spread across 3.5 million square miles.
By necessity, that makes the idea of an "average" home price more slippery. But let's not let such quibbles clog up our spreadsheet! Not after math PhDs, applied to mortgage-backed zeroes, clicked and dragged the answer "AAA" whenever asked. And not before we contend with the data itself.
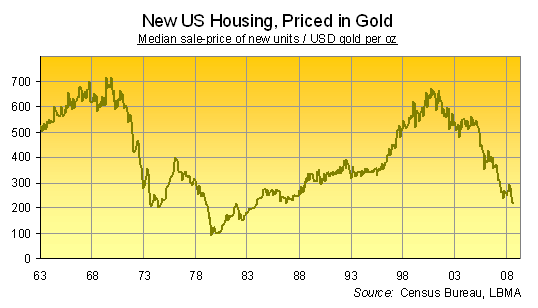
This first chart's solid enough, thanks to the certainty with which the Census Bureau dispenses its data.
It shows the median price of new US housing, at sale, divided by the ounce-price of gold, monthly average. And as you can see, new housing has swung wildly – measured in ounces – over the last 45 years. Quite clearly, one made a better home for investment than the other over distinct periods, as the mid-way price of new homes (half the market paid less, the other half more) was rocked and rolled by booms, bubbles and busts in both bricks and bars.
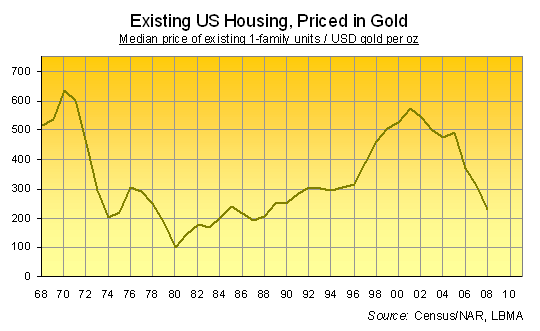
Second up, existing homes bought on the secondary market – and the same picture, but only on an annualized basis (and with the National Association of Realtors thrown in as a source) for the Census Bureau's less lengthy, less detailed data.
You can see, between the two charts, how new housing during this last real-estate boom (2000-2006 in nominal prices) began and topped out much sooner when priced in terms of gold. New units also reached further above existing-home prices too, peaking at $243,000 in 2006 – then 550 ounces of metal – or some 10% higher than the secondary market.
Perhaps that extra cash paid for new homes' expanding foot-print. But it's also worth noting, turning aside from Gold Investment for a moment, that new US home prices this decade also saw the mean outstripping the median as never before. The gap between average and mid-point prices, in fact, gaped from one-fifth or less (1975-1999) to as wide as 30% during the summer of 2006. Which might show, we guess, a growing number of super-priced units way up at the top-end of the market...bought and paid for, perhaps, with bonuses skimmed off mortgage-backed bonds sold against the sub-median half.
Finally, the money shot...
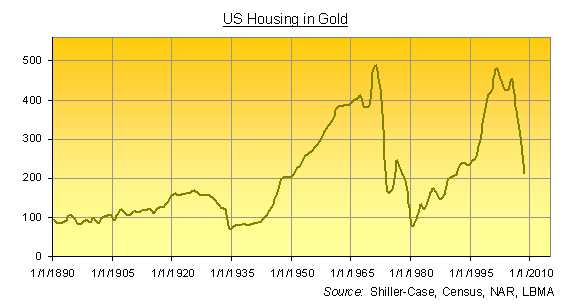
True long-run figures for housing, like the concept of "average" itself, are more sketchy than Mel Gibson after a night on the sauce.
We've used Robert Shiller's invaluable numbers, of course, but they only come as an index, itself built from five sources stretching back to 1890. Rolling those numbers back from today's current average ($175,000 according to the NAR) only throws up big gaps with the Census Bureau prices, collated and published every 10 years starting with 1940. It would also put the price of US housing above $4,000 in 1900 – and in 1900 dollars, too – when average wages were just $2 per day.
Hence the kneading and folding used to smooth out the chart above into something like a loaf of home prices vs. gold. As for the baking, home-buying at the start of our chart was yet to meet democracy through that great 20th century liberator, the securitized mortgage loan. And yes, two-thirds of US homes had yet to gain running water, let alone electricity. But as in the UK House-Price to Gold Ratio, it seems Gold Bullion regained its Great Depression value in housing as the Great Inflation of the 1970s peaked out, suggesting (to us, at least) that its utility as a store of value was little diminished by new bath fittings and copper wiring.
The broad sweep – smoothed out to fix those anomalies which our quick desk-bound research, a mere 5,000 miles from the Library of Congress throws up – remains as broad and as sweeping as either gold bulls or bears might hope to spy.
From here, the bottom in housing may still be to come, at least priced in gold. Broad-sweeping investors are invited to draw their own conclusions.


 Email us