Gold, Global Interest Rates & the Fed Funds Cycle
Tuesday, 6/17/2014 10:13
US interest-rate phases move gold prices. So does the E7 of emerging economies...
WE RECENTLY welcomed Doug Peta, an economist from BCA research, to our offices,
writes Frank Holmes, CEO and chief investment officer at US Global Investors.
He presented some interesting research regarding the Fed Funds Rate Cycle, and in turn, what that research could mean for gold. I wanted to share points from his presentation, as well as our own in-house research, to help you understand the positivity we see for the precious metal looking towards 2015.
Where are we now? Below is a chart from BCA showing the Fed Funds Rate Cycle. In essence, this chart neatly illustrates what the interest rate cycle imposed by the US Federal Reserve looks like. The red circle indicates where we are right now: Phase IV, also known as the "easing" phase of the monetary policy that was enacted in 2008 in the US, better known as quantitative easing (QE).
As we know, the Fed enacted QE to stimulate our nation's economy. Right now we're benefitting from our placement in Phase IV of this cycle because it is in this phase that the Fed is able to keep interest rates low, keep reserve requirements low and continue printing money. Similarly, when money is "easy", businesses can find funding for projects and consumers have easier access to credit.
Historically, Phase IV (as well as the shift towards Phase I) are the best for equity investors because stocks usually rise during these two positions in the cycle.
We have been in Phase IV of the Fed Funds Rate Cycle for a few years now, and are expected to remain here into 2015. Eventually the Fed will have to start tightening again and raise rates, although the numbers should remain relatively low for a while. Once this begins, we will move into Phase I.
When it comes to the performance of gold and gold stocks, history indicates good times are ahead based on where we are in the cycle. Take a look at the tables below showing median returns during the cycle dating back to 1970 and 1971. You'll see that for gold and gold stocks, Phase IV and Phase I both show the highest median returns.
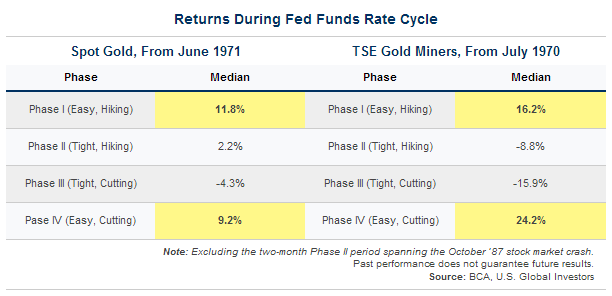
The reason for the high returns during these two phases is because of "easy money." Tight money, which is what Phase II and III are based upon, is typically bad for gold investors. When money is tight, we don't have inflation, and investors don't need to turn to gold as a hedge against inflation. Without inflation there is no need to hedge.
Another reason we've traditionally seen gold investors benefitting during Phases IV and I of the cycle is that when money is easy, interest rates are low, meaning less opportunity cost for holding the precious metal. To help illustrate, imagine putting your money in a savings account and earning 5% on it. Well, the opportunity cost of keeping gold under your mattress would be giving up that 5% that you could be earning elsewhere. When your savings account yields next to nothing, some reason, why not just buy some gold?
This pattern is worldwide; the trends we see in the Fed Funds Rate Cycle are not only US specific. This same idea carries through to the stimulative policies of the European Central Bank and Japan. More countries around the world are applying monetary stimulus programs much like the US, while moving away from more restrictive policies.
Remember, restrictive policies relate to tightening, which is bad for
gold prices, and stimulative policies relate to easing, which is good for gold.
Right now, gold could use a pick-me-up, and here's why. Over the last several years we've seen slowing money supply growth in many E7 countries. E7 refers to seven countries with emerging economies including China, India, Brazil, Mexico, Russia, Indonesia and Turkey. It's these countries that drive the Love Trade for gold, primarily China and India, which purchase the metal for religious and cultural celebrations.
With less money being spent or borrowed, not only did the Love Trade begin to slow, global GDP growth also began to slow as you can see below.
The good news is, as we see various countries applying monetary stimulus, including emerging markets, we can expect this to contribute to global GDP growth. In 2014, global GDP is expected to grow by 3.2%,
according to the World Bank's latest projections.
Similarly, the money supply of the United States has been a steady grower and the money supply in the E7 countries is also expected to reverse course; right now it is growing again but at a slower rate. The US data suggests that a new easing cycle is starting in Europe, Japan and emerging markets. A pickup in economic activity in the E7, especially the big gold consumers, is yet another positive sign for the yellow metal.
Real interest rates are headed lower for most of the world as well. As money supply grows, countries eventually feel inflationary pressures. This will hold true in the US as we move into 2015 and back into Phase I. All of these changes can lead to a declining confidence in paper money, yet another good sign for gold.


 Email us