Why Food Prices Have Become So Volatile
Food prices have been jolted out of their long period of stability...
LAST YEAR was an abysmal one for the global insurance industry, which had to cover yet another enormous increase in damages from natural disasters. Unknown to most casual observers is the fact that during the past few decades the frequency of weather-related disasters (floods, fires, storms) has been growing at a much faster pace than geological disasters (such as earthquakes), writes Gregor Macdonald.
This spread between the two types of insurable losses has moved so strongly that it prompted Munich Re to note in a late 2010 letter that weather-related disasters due to wind have doubled and flooding events have tripled in frequency since 1980. The world now has to contend with a much higher degree of risk from weather and climate volatility, and this has broad-reaching implications.
And, critically, it has a particular impact on food.
Many factors seen over the past decade have produced higher food prices: population growth, urbanization, the decline of arable land per person, and the upgrading of diets for example. But more damaging than food inflation has been the pushing of global food prices out of their long, quiet envelope of stability. From the recently released UN Report on the World Food Situation:
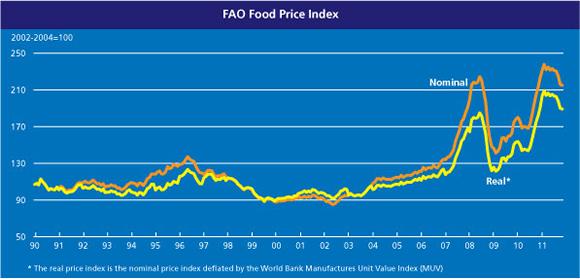
The FAO Index (Food and Agriculture Organization of the UN) shows that, while prices are once again down from a peak, a troublesome volatility started to affect food prices this decade. These are the very prices that caused social instability in countries like Mexico in 2007-2008 (pressure on corn prices, owing in part to US corn ethanol mandates) and more recently in northern Africa (Arab Spring).
Commodity observers will note the rough correspondence with oil prices, and of course that's no mistake. Inputs to food production are heavily composed of fossil fuels. In the same way that both high (and highly volatile) oil prices play havoc with economies, food prices and marginal speculation in food have done the same.
2011 also saw the highest average oil prices since 2008, at $94.81 per barrel. That is not far below the average high of 2008, at $99.67. In between was a crash in oil prices — and most commodities — which unfolded at a rate almost as rapid as the original run-ups from 2006-2008. What happens next?
The USDA has just released its Food CPI readings for 2011, along with their forecast for 2012.
With 11 months of data recorded, the outlook for the 2011 Consumer Price Index (CPI) and food price inflation has become clear. The CPI for all food is projected to increase 3.25 to 3.75 percent. Food-at-home (grocery store) prices are forecast to rise 4.25 to 4.75 percent, while food-away-from-home (restaurant) prices are forecast to increase 2 to 2.5 percent. Although food price inflation was relatively weak for most of 2009 and 2010, cost pressures on wholesale and retail food prices due to higher food commodity and energy prices, along with strengthening global food demand, have pushed inflation projections upward for 2011.
For 2012, food price inflation is expected to abate from 2011 levels but is projected to be slightly above the historical average for the past two decades. The all-food CPI is projected to increase 2.5 to 3.5 percent over 2011 levels, with food-at-home prices increasing 3 to 4 percent...
With non-existent wage growth and a dearth of investment opportunities, these price advances in food costs have much more impact than it appears. What asset classes are keeping pace with the year-over-year increases in food? Certainly not stocks, as the S&P 500 has gone nowhere in a decade. Moreover, a 3.5% increase in Food CPI this year, with more to come next year, falls on top of a deeply under-utilized US economy in which tens of millions derive income from government transfer payments, most of which are not sufficiently ratcheting higher from "inflation-adjustments." Food Stamp recipients, for example, are not seeing food inflation adjustments in their benefit checks that would compensate for the price increases. Not even close.
As you may have heard, milk was the top commodity performer in 2011, up 40% on the year in the futures market. A question: do you think milk is a central staple in American family diets?
There's more. On a year-over-year basis through November, according to USDA, beef prices are up 9.8%, egg prices are up 10.25%, and potato prices are up 12%. (This partly explains why junk-type grocery foods make up an ever-larger portion of food-stamp purchasers' shopping carts. Sadly, people are buying caloric content, not nutrition).
Now, compare these price increases to the average individual Food Stamp benefit, which is basically flat year-over-year, moving from $133.79 in 2010 to $133.84 in 2011. And to the extent that US households use Food Stamp benefits to plug overall cash flow problems, the very central and related pressure from higher gasoline prices also deflates the impact of the Food Stamp benefit.
The march higher in Food Stamp participation following the 2008 crisis has been relentless. The trend has paid no attention whatsoever to assertions of economic recovery or jobs growth in the US.
Yes, in the aggregate there has been moderate growth in private sector payrolls since the lows. There has also been a very big turnaround in exports, as this part of the economy has seen a veritable resurrection, growing to 15% of GDP. However, the upsurge in national Food Stamp participation has been stronger than them all. In December of 2007, just after the declared start of the "recession," national participation in SNAP (Supplemental Nutritional Assistance Program) stood at 27.385 million. As of the latest data, this has ballooned to 46.268 million.
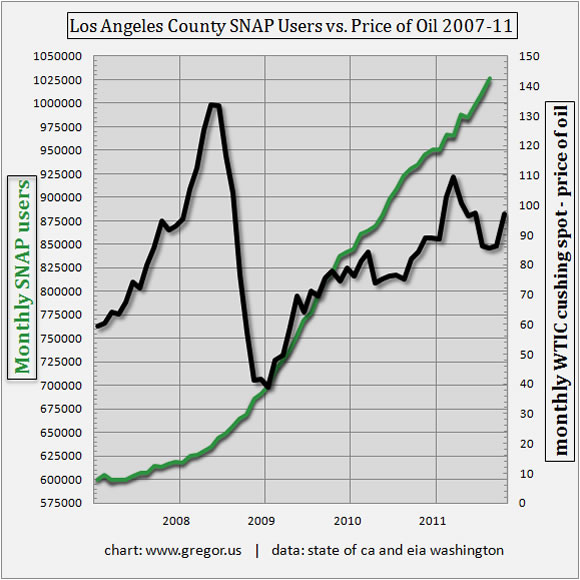
Because the national figures are so enormous and harder to comprehend, for several years I have kept track of Food Stamp (SNAP) users in Los Angeles County — alongside oil prices. Southern California illustrates well the dilemma for most of the nation: Through the force of US demand, we have lost the control we once enjoyed over oil prices, while at the same time we remain locked in to automobile-based transport. Previous recessions in the US would have knocked gasoline prices down for longer. Not so anymore. Earlier this year, it became clear to me that before year end, the number of LA County participants on Food Stamps would eventually cross the one million mark. That grim marker has now been achieved:
The above chart of LA County SNAP users echoes the FAO chart from the United Nations. Upward-moving volatility in energy is concurrent with wild swings in food prices and waves of people in need of public assistance. Wages in the US have remained flat while millions of workers remain either unemployed or underemployed. Meanwhile, urbanization in the developing world has continued apace, forcing food prices and energy prices up at the margin. The results are not complicated. When demand begins to hit a resource whose supply cannot be easily increased, then price moves to ration demand and price becomes more volatile.
That process, so obvious to many, can unfortunately digress into a series of time-wasting arguments about speculators and whether the world is running out of...(insert your preferred natural resource here). On the contrary, natural resources rarely, if ever, run out in the marketplace. The US is not running out of oil, or corn, and the world is not running out of coal, or copper.
What we have seen however in the past decade is that a number of structural changes to human development, primarily industrialization in the Non-OECD, have combined to put an unexpectedly large burden of demand on world resources – at a rapid rate. Meanwhile, many natural resources, such as copper and oil in particular, had already reached a more difficult place in the arc of their own extraction history when this started to unfold.
The result is that energy resources, and thus the ease of using energy resources in food production, began to converge with a long decline in the availability of arable land.
It is not for nothing that farming acreage in the US Midwest is up over several hundred percent since the lows twenty years ago. (As a personal aside, I remember those lows very well; I lived on a struggling soybean farm in Iowa during graduate school in the late 1980s). The world is in the midst of a New Great Game. But this time, the hunt is not on only for energy resources, but for agricultural resources — mostly cropland.
On my own blog, I recently did a short post on a study of urbanization in China's Pearl River Delta and its aggregate effect on climate and precipitation. In short? Paving over the earth decreases rainfall. I also found these two photos from NASA, comparing satellite views of the Pearl River Delta over a 24-year period from 1979 to 2003.
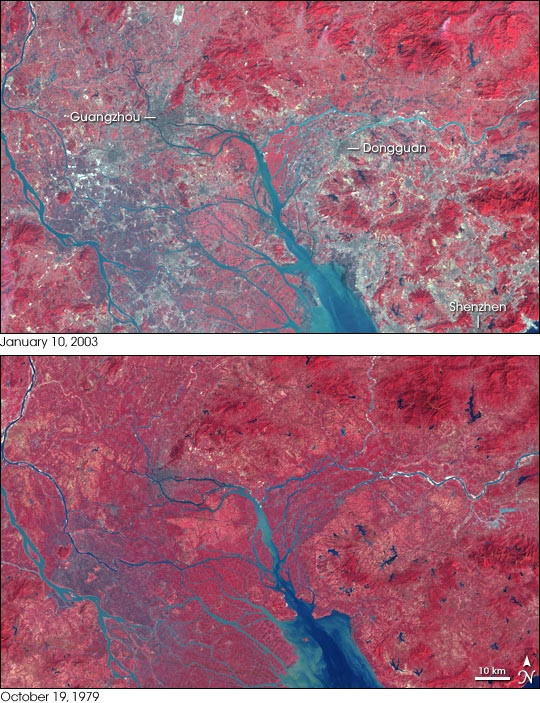
The loss of arable farmland per capita in China has placed enormous pressure on the global food system and all of its inputs, especially fertilizer. The miracle of the food revolution, much trumpeted over the past 30 years as the latest achievement of technology and innovation, is not to be dismissed. But there are limits. We can only convert so much farmland to urbanscape while making up the difference with N, P, and K (Nitrogen, Phosphorus, and Potassium) before we lose resiliency — and redundancy — in the global food system.
It did not used to be the case that a bad wheat crop in Australia or the Ukraine would hit global wheat prices so hard. Moreover, because food is a renewable resource, a level of overconfidence about our ability to respond to demand crept into policy-making and forecasting.
Looking to protect your wealth with a Gold Investment?...


 Email us