Gold News

Q3 Commodity Round-Up

How QE3 hit commodity prices in Q3 led by Silver Bullion...

OVER THE LAST 3 months, writes Sumit Roy at Hard Assets Investor, the biggest macro-economic events were the resumption of the European Central Bank's bond-buying program and the launching of the Federal Reserve's third round of quantitative easing – known as QE3 or rather "QE unlimited".

Silver Bullion was the best-performing commodity this quarter, up 25.3% thanks to the Fed's decision to initiate QE3. Prices for both silver and gold are holding under formidable double-top resistance levels near $36 and $1800, respectively.

Investor flows into the two metals continued at a rapid pace, as Silver ETF holdings and Gold ETF holdings hit record levels at 600 million troy ounces and 82 million troy ounces, respectively.

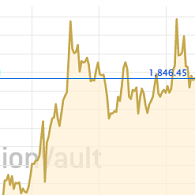
Strong investor appetite should help power prices higher. A break of double-top resistance would expose a clear path to the next layers of resistance for silver and gold at $40 and $1920, respectively. Gold Prices rose 11% versus the Dollar between July and end-September.

In the grain complex, wheat led the way higher in Q3 – up just over 22% – on speculation that Russia would limit exports due to supply concerns. Corn and soybeans performed well early in the period, but began to fade toward the end of the quarter, cutting their Q3 rise to 12% and 5% respectively on news that the US harvest was proceeding faster than expected.

However, data from the USDA today showed that corn stocks at the beginning of September were much lower than anticipated. The department reported that US corn stocks as of Sept. 1 totaled only 988 million bushels, down 12% from a year ago and below the 1.166 billion bushels that analysts had expected.

Wheat stocks also came in below expectations at 2.104 billion bushels, under the consensus estimate of 2.266 million. However, soybeans stocks totaled 169 million bushels, above the 130 million that was anticipated. The correction in corn prices may be over following this news, and we would look to initiate long positions on pullbacks.

In terms of commodity performance this quarter, crude oil found itself in the middle of the pack. The commodity largely took its cues from movements in the broader financial markets, though that could change if tensions between Iran and Israel pick up in the coming months as some analysts expect.

Brent strongly outperformed WTI, with a gain of almost 15% compared with 8%, as the spread between the two benchmarks widened. Surging production in the US Midwest continues to saturate the region with crude.

As we wrote this week, US output is at a 15-year high thanks to the boom in unconventional oil drilling. The trend of growing US production is expected to remain in place over the next few years, which will help to limit upside in prices. Nevertheless, prices could rise significantly in the event of supply disruptions in the Middle East or a spike in emerging market demand should economic conditions improve.

Elsewhere in energy, natural gas prices surged to 10-month highs near $3.30/mmbtu, as traders began to anticipate the coming winter heating season, ending the quarter 16% higher. As we wrote on Thursday, the inventory surplus is on pace to be eliminated in the coming weeks; however, the fact that production remains so resilient will cap upside for prices.

Copper trading action was relatively lackluster for most of the third quarter, but a surge in September allowed prices to finish the period with a respectable 7% gain. The Fed and ECB's stimulus efforts and anticipation of potential easing by Chinese authorities catapulted prices higher.

Currently, the industrial metal is consolidating between $3.70 per pound and $3.85. Expect prices to take their cues from movements in broader financial markets.

Looking ahead, in the last week of the third quarter US data were mixed. Durable goods orders plummeted 13.2% in August. Excluding the volatile transportation sector, orders still fell by 1.6%.

On the positive side, the Case-Shiller home price index grew by 1.2% year-over-year in July, up from the prior month's 0.59%. That's the second-straight month of year-over-year gains, and suggests that the housing market may be turning the corner.

Finally, personal spending in the US rose by 0.5% in August, matching expectations. Personal income in the month rose by 0.1%, slightly below the 0.2% that was anticipated.

Looking to Buy Silver or physical gold today? Make it simple, secure and ultra-cost effective using world #1 online, BullionVault...
 

Hardassetsinvestor.com is a research-oriented website devoted to sharing ideas about investing in the natural resources sector. Published by Van Eck Associates Corporation, the site offers an educational resource for both individual and institutional investors interested in learning more about commodity equities, commodity futures, and gold – the three major components of the hard assets marketplace.

See full archive of Hard Assests Investor.
 

Please Note: All articles published here are to inform your thinking, not lead it. Only you can decide the best place for your money, and any decision you make will put your money at risk. Information or data included here may have already been overtaken by events – and must be verified elsewhere – should you choose to act on it. Please review our Terms & Conditions for accessing Gold News.

Follow Us

Facebook Youtube Twitter LinkedIn


Market Fundamentals